How are Sisra Basic Projections calculated?
Sisra Basic Projections are calculated by comparing a student’s expected grade with their current attainment. The following steps explain how this is calculated in the reports using an EAP created for demonstration purposes:
1 / What is the student’s expected grade?
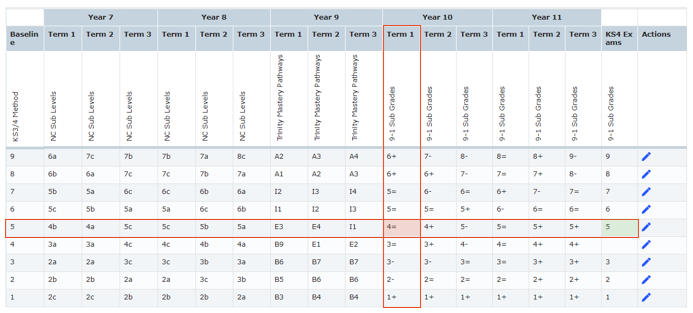
To find a student’s expected grade for a qualification, Analytics will identify the baseline they have uploaded and compare this with the term for the report you’re working with.
Using the example below, students with a baseline grade 7 would be expected to achieve a grade 5= in all reports linked to Year 10 Term 1.

2 / Is the student’s current attainment the same as their expected grade?
Analytics will then compare this expected grade with the student’s current attainment grade which has been uploaded into the data set or assessment collection for the report you’re working with. For example, if you are working with Y11 Autumn assessments, this will compare the expected grade to the grade uploaded into the Y11 Autumn assessment collection.
If the student’s current attainment is the same as their expected grade, Analytics will pull through the grade entered in the KS4 Exams column for that row to the reports when using the Project functionality.
For example, if this student’s current attainment was a grade 5= (the same as their expected grade), the grade 7 would pull through as their projected grade.
If their current attainment grade is different to their expected grade, Analytics would continue to the next step.
3 / Is the student’s current attainment shown for ONE other pathway for that term?
If the student’s current attainment is NOT the same as their expected grade, Analytics will check to see if their current attainment grade is available for an alternative pathway.
If the current attainment grade is available for ONE other pathway, Analytics will pull through the grade entered in the KS4 Exams column for that new row to the reports when using the Project functionality.
For example, if this student’s current attainment is a grade 4=, they would be seen as BELOW track. As the grade 4= appears within ONE other pathway within the Year 10 Term 1 column, this new row would be used and the grade 5 would pull through as their projected grade.

If their current attainment grade is available for MORE than one pathway, see the next step.
4 / Is the student’s current attainment shown for MULTIPLE different pathways for that term?
If the current attainment grade is available for MULTIPLE different pathways, Analytics will pull through the grade entered in the KS4 Exams column for closest row for the student’s original baseline, to the reports when using the Project functionality.
For example, if this student’s current attainment is a grade 6+, they would be seen as ABOVE track. As the grade 6+ appears within MULTIPLE different pathways within the Year 10 Term 1 column, the row closest to the original baseline 7 would be used, meaning the grade 8 would pull through as their projected grade.

5 / Is the student’s current attainment NOT shown for that term?
If the current attainment grade is NOT available for a different pathway, Analytics will determine the two pathways their grade falls between for that term. The grade entered in the KS4 Exams column for the lowest out of these two rows will pull through to the reports when using the Project functionality.
For example, if this student’s current attainment is a grade 4+, they would be seen as BELOW track. As the grade 4+ does not appear within the Year 10 Term 1 column, two rows this falls within are identified. In this case, these would be grades 4= and 5= for baselines 5 and 6 respectively. Analytics would then use the lowest of these pathways (4=), meaning the grade 5 would pull through as their projected grade.

Thanks for reading!
